
How Much Could Your Investments Grow?
Use our free UK investment calculator to see how your money could grow over time through the power of compound interest. Enter your initial lump sum, monthly contributions, expected annual return, and investment period to get an instant projection. For context, UK equities have returned an average of 7–8% per year historically, while global equities have averaged around 5.2% in real terms over 125 years. Holding investments in a Stocks and Shares ISA keeps all growth completely tax-free.
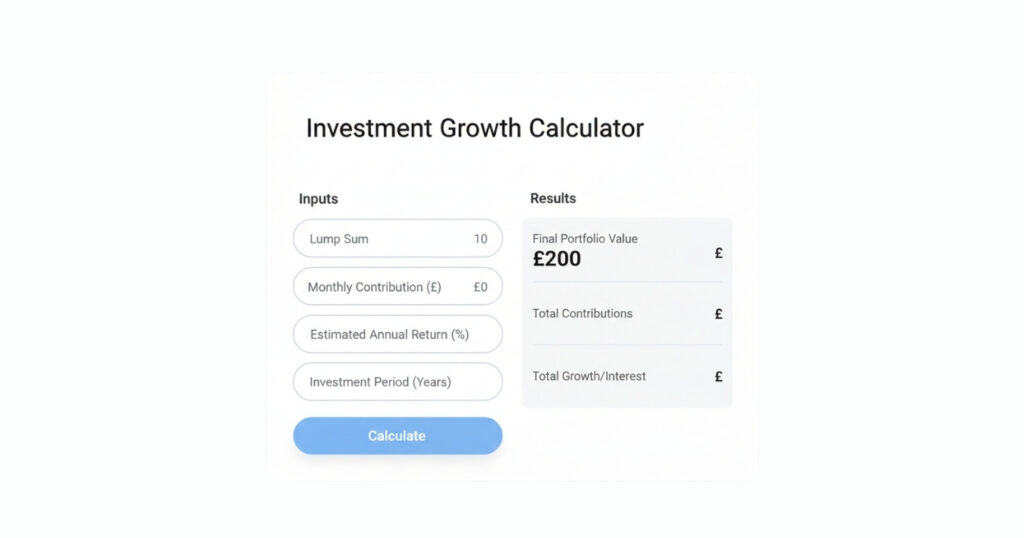
UK Investment Calculator
Use the calculator below to project how your savings and investments could grow over time. Adjust the inputs to model different scenarios
How Does the Investment Calculator Work?
The investment calculator uses the standard compound interest formula to project the future value of your money. You enter four key inputs — your initial investment, monthly contributions, expected annual return, and time horizon — and the tool calculates how your wealth could grow as returns are reinvested and compounded over time.
The formula behind the calculator is:
FV = P(1 + r/n)^(nt) + PMT × [((1 + r/n)^(nt) − 1) / (r/n)]
Where P is your initial investment, r is the annual return rate, n is the compounding frequency, t is the number of years, and PMT is your regular contribution per period. You do not need to understand this formula — the calculator handles everything for you. Simply enter your numbers, choose your account type (ISA, SIPP, or GIA), and view your projected returns instantly.
The calculator also provides a year-by-year breakdown so you can see exactly how compound growth accelerates over time. This is particularly useful for setting realistic savings targets or comparing the impact of increasing your monthly contributions by even a small amount.
What Is Compound Interest and Why Does It Matter?
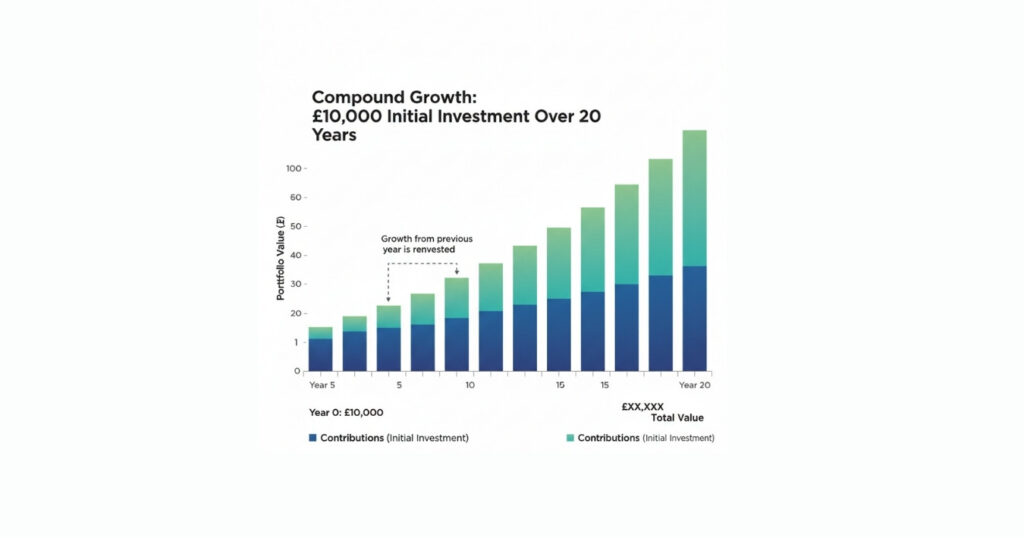
Compound interest is the process of earning returns on both your original investment and on the returns you have already accumulated. Unlike simple interest, which only applies to your initial deposit, compound interest creates a snowball effect where your money grows faster the longer it remains invested.
Albert Einstein reportedly called compound interest “the eighth wonder of the world”, and the mathematics bear this out. According to the UBS Global Investment Returns Yearbook 2025, produced by researchers at the London Business School, global equities have delivered an annualised real return of 5.2% over 125 years (Cambridge Judge Business School, March 2025). At that rate, £10,000 invested without any additional contributions would grow to approximately £27,100 after 20 years in real terms.
The critical variable is time. An investor who starts contributing £200 per month at age 25, earning a 7% annual return, would accumulate approximately £525,000 by age 65. Starting just ten years later at age 35 with the same contributions would produce roughly £244,000 — less than half the total, despite contributing only £24,000 less in actual deposits. This dramatic difference is entirely driven by compound growth having an extra decade to work.
Compounding works best when three conditions are met: you start early, you reinvest all returns rather than withdrawing them, and you keep costs and taxes low. For UK investors, this means prioritising tax-efficient accounts like ISAs and SIPPs, choosing low-cost index funds or ETFs, and resisting the temptation to withdraw during market downturns.
- Global equities have returned an annualised 5.2% in real terms over 125 years (UBS/DMS Database 2025).
- Starting 10 years earlier at £200 per month could mean approximately £281,000 more by retirement at 7% annual returns.
- Compound growth rewards patience, with a large proportion of total returns typically occurring in the final third of a long investment period.
- Keeping fees below 0.5% per year and using ISAs can add tens of thousands to your final balance.
What Rate of Return Should UK Investors Expect?
Choosing a realistic expected return is the most important input in any investment calculator. Too optimistic and you may underestimate how much you need to save; too conservative and you may set unnecessarily aggressive targets.
Historical data provides useful benchmarks. The FTSE 100, the UK’s flagship stock market index, has delivered an average annualised total return of approximately 7.5% per year (including dividends reinvested) since its inception in 1984 (Investing in the Web, January 2025). Without dividends, the price-only return was significantly lower at around 5.4%, highlighting how important dividend reinvestment is to long-term wealth building.
For broader global exposure, the S&P 500 has delivered an average annual return of approximately 10.3% in nominal terms since 1957 (S&P Global). However, UK investors also face currency risk when holding US or global equities, as fluctuations in the GBP/USD exchange rate can either boost or reduce returns.
In real terms (after adjusting for inflation), a widely referenced benchmark comes from the UBS Global Investment Returns Yearbook 2025, which found that worldwide equities returned 5.2% per year in real terms over 125 years, bonds returned 1.7%, and cash just 0.5%.
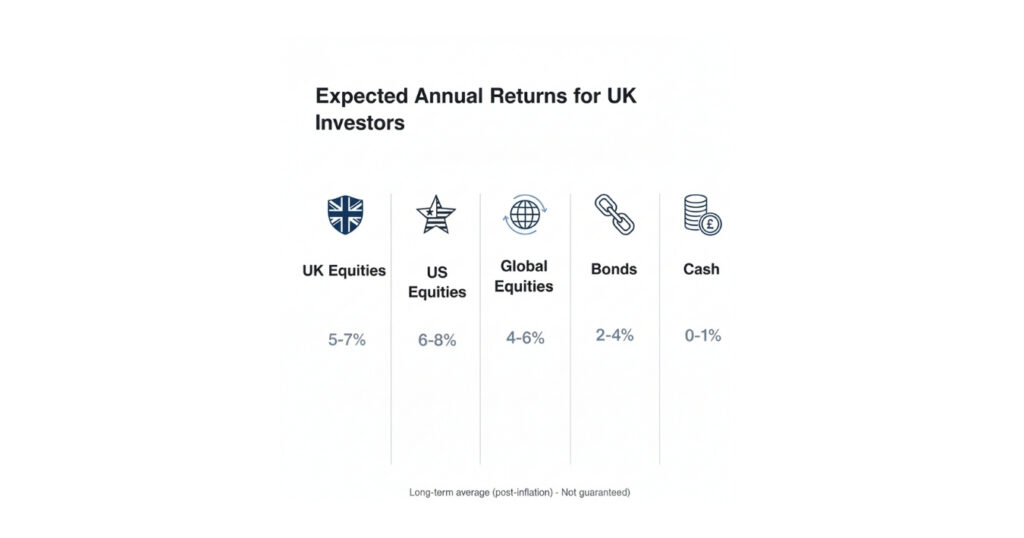
Expected Return Benchmarks for UK Investors
Historical Investment Returns by Asset Class
| Investment Type | Nominal Return | Real Return | Source |
|---|---|---|---|
| UK equities (FTSE 100) | 7–8% | 4–5% | IG / Investing in the Web |
| US equities (S&P 500) | 10.3% | 7–8% | S&P Global |
| Global equities | 8–10% | 5.2% | UBS Yearbook 2025 |
| UK bonds (gilts) | 3–4% | 1.7% | UBS Yearbook 2025 |
| Cash savings | 3–5% (2025/26) | 0–2% | Bank of England |
| 60/40 portfolio | 5–7% | 3–4% | Moneyvator |
Sources: UBS Global Investment Returns Yearbook 2025, S&P Global, IG UK, Moneyvator. Past performance is not a reliable indicator of future results.
A conservative approach for long-term equity projections is to use 5–7% per year, which accounts for inflation and fees. If you hold a diversified global equity portfolio, 7% nominal (before inflation) is a commonly used planning assumption. For a blended portfolio with bonds, 4–5% is more appropriate.
- UK equities (FTSE 100) have averaged approximately 7.5% per year with dividends reinvested since 1984.
- Global equities have averaged around 5.2% per year in real terms over 125 years (UBS Yearbook 2025).
- Use 5–7% for conservative long-term equity projections and 3–5% for blended portfolios.
- Always account for inflation, fees and currency movements when setting return expectations.
How Does Your Account Type Affect Returns?
Where you hold your investments matters almost as much as what you invest in. The UK tax system offers several account types with different tax treatments, and choosing the right wrapper can add thousands of pounds to your final balance over the long term.
Stocks and Shares ISA (Tax-Free)
A Stocks and Shares ISA is the most tax-efficient option for most UK investors. All capital gains, dividends, and interest earned within the ISA are completely free from tax. The annual ISA allowance for the 2025/26 tax year is £20,000. You can invest in shares, funds, ETFs, bonds, and investment trusts within the wrapper.
For the investment calculator, this means the projected return is exactly what you keep — no deductions for Capital Gains Tax or dividend tax. If you are investing for the long term and have not yet used your annual ISA allowance, this should almost always be your first choice.
SIPP (Pension)
A Self-Invested Personal Pension (SIPP) provides tax relief on contributions. Basic rate taxpayers receive 20% tax relief automatically (so a £100 contribution costs you £80), while higher rate taxpayers can claim an additional 20% through their tax return. Growth within the SIPP is tax-free, but withdrawals are taxed as income — except for the 25% tax-free lump sum you can take from age 57 (rising from 55 in April 2028).
General Investment Account (GIA)
A GIA has no annual contribution limit, but gains and income are taxable. For the 2025/26 tax year, Capital Gains Tax applies on gains above the £3,000 annual exempt amount at rates of 18% (basic rate) or 24% (higher rate). Dividends above the £1,000 annual allowance are taxed at 8.75%, 33.75%, or 39.35% depending on your income tax band.
Tax Impact Comparison: £10,000 Over 20 Years at 7%
Account Type Comparison: Tax Impact on Investment Returns
| Account Type | Final Value (gross) | Tax Payable | Net Value (approx.) |
|---|---|---|---|
| Stocks & Shares ISA | £38,697 | £0 | £38,697 |
| SIPP (basic rate)* | £48,371 | Income tax on withdrawal | Varies |
| GIA (basic rate)** | £38,697 | £4,200 in CGT | £34,500 |
*SIPP figure includes 20% tax relief boosting the initial £10,000 to £12,000. **GIA tax estimate assumes gains crystallised in the final year above the £3,000 CGT allowance. Figures for illustration only.
How Much Should You Invest Each Month?
There is no single correct answer — the right monthly contribution depends on your income, expenses, financial goals, and time horizon. However, using the investment calculator to model different scenarios can help you find a realistic target.
As a general guideline, many financial planners suggest saving at least 10–15% of your gross income for retirement. The Pensions and Lifetime Savings Association (PLSA) publishes annual Retirement Living Standards, which in 2024 estimated that a single person needs approximately £43,100 per year for a “comfortable” retirement, while a couple needs £59,000 (PLSA, Retirement Living Standards 2024).
Monthly Contribution Growth Projections (7% Annual Return)
Monthly Investment Growth at 7% Annual Return
| Monthly | After 10 Yrs | After 20 Yrs | After 30 Yrs | After 40 Yrs |
|---|---|---|---|---|
| £100 | £17,300 | £52,100 | £121,300 | £262,500 |
| £200 | £34,600 | £104,200 | £242,600 | £525,000 |
| £300 | £51,900 | £156,300 | £363,900 | £787,500 |
| £500 | £86,500 | £260,500 | £606,500 | £1,312,500 |
| £1,000 | £173,000 | £521,000 | £1,213,000 | £2,625,000 |
Figures rounded. Assumes 7% annual return compounded monthly, no initial lump sum, no fees or inflation adjustment. For illustration only.
The most striking pattern in this table is how dramatically the figures grow in the later decades. An investor contributing £200 per month would accumulate just £34,600 after 10 years, but this explodes to £525,000 after 40 years. More than three-quarters of the final balance is generated in the second half of the investment period, illustrating why starting early is so powerful.
If you cannot afford a large monthly contribution now, start with whatever you can manage — even £25 or £50 per month. Platforms like Trading 212 and InvestEngine allow you to start investing from as little as £1.
What Is Pound-Cost Averaging and How Does It Help?
Pound-cost averaging is the strategy of investing a fixed amount at regular intervals — for example, £200 on the first of every month — regardless of whether markets are rising or falling. The investment calculator’s monthly contribution feature effectively models this approach.
The advantage is that you automatically buy more units when prices are low and fewer when prices are high, which smooths out the average cost of your investments over time. This removes the pressure of trying to “time the market”, which even professional fund managers struggle to do consistently. According to S&P Global’s SPIVA report (2024), more than 90% of actively managed funds underperformed their benchmark index over a 15-year period.
Pound-cost averaging is particularly effective for volatile investments like equity index funds. During the COVID-19 crash of March 2020, the S&P 500 fell approximately 34% in a single month, but investors who maintained their regular contributions bought units at heavily discounted prices and benefited enormously from the subsequent recovery.
For UK investors using a Stocks and Shares ISA, setting up a monthly direct debit into a low-cost index fund or ETF is the simplest and most effective way to implement pound-cost averaging. Platforms like Trading 212 and InvestEngine offer zero-commission regular investing, making this strategy accessible from as little as £1 per month.
How Do Fees Affect Your Investment Returns?
Investment fees compound just as powerfully as returns — but in the opposite direction. Even seemingly small differences in annual charges can erode tens of thousands of pounds from your portfolio over a multi-decade investment horizon.
There are three main costs to consider: the fund’s ongoing charge (Total Expense Ratio or TER), the platform fee, and any dealing charges. A typical low-cost global index fund like the Vanguard FTSE Global All Cap Index Fund charges a TER of 0.23%, while the Vanguard S&P 500 ETF (VUAG) charges just 0.07%. Platform fees vary widely — Trading 212 charges no platform fee, while Hargreaves Lansdown charges 0.45% per year on the first £250,000.
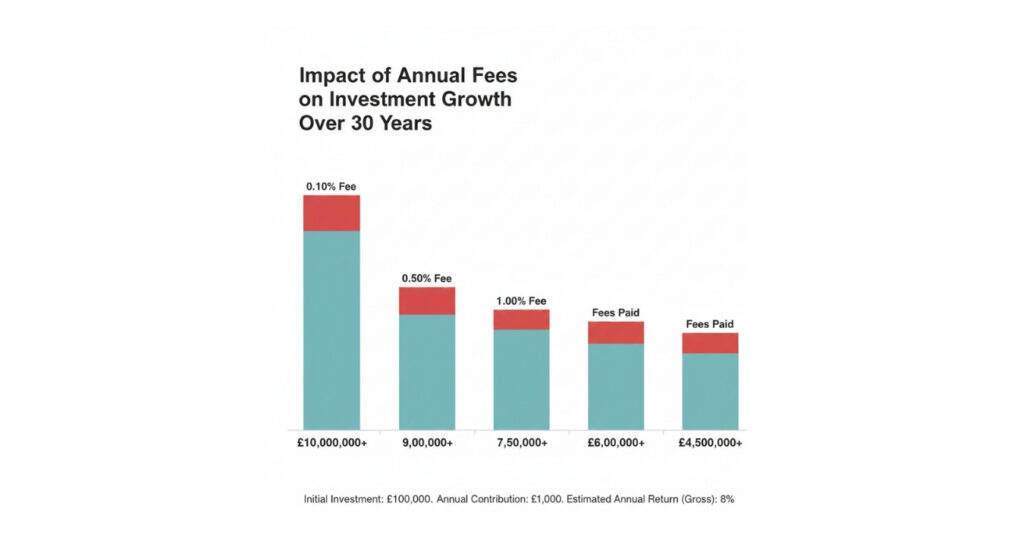
The Impact of Fees: £10,000 + £200/month Over 30 Years at 7%
Impact of Fees on Long-Term Investment Growth
| Total Annual Fee | Final Value | Lost to Fees |
|---|---|---|
| 0.10% (ultra-low cost) | £250,700 | — |
| 0.50% (low cost) | £232,200 | £18,500 |
| 1.00% (medium cost) | £213,100 | £37,600 |
| 1.50% (higher cost) | £195,500 | £55,200 |
| 2.00% (expensive) | £179,200 | £71,500 |
Figures rounded. Assumes 7% gross annual return compounded monthly, reduced by the stated fee. For illustration only.
The difference between a 0.10% and a 2.00% annual fee on this example is £71,500 — more than double the £58,000 in actual deposits made over 30 years. This is why fee transparency is so important and why low-cost index investing has gained enormous popularity among UK investors.
When using the investment calculator, enter a return figure that is net of fees for the most accurate projection. For example, if you expect 7% gross returns and pay 0.50% in total fees, enter 6.5% as your expected return.
- A 1% difference in annual fees can cost £37,600 over 30 years on a £10,000 plus £200 per month portfolio.
- Low-cost index funds (TER 0.03–0.23%) significantly reduce the drag on compound growth.
- Zero-commission platforms such as Trading 212 and InvestEngine help minimise platform costs.
- Enter your expected return net of fees in the calculator for a more realistic projection.
Investment Calculator Examples for UK Investors
To help you get started, here are four common scenarios modelled through the calculator. All examples assume a 7% nominal annual return compounded monthly, held within a Stocks and Shares ISA (tax-free).
Scenario 1: Graduate starting early (age 22)
Initial investment: £0 | Monthly contribution: £100 | Period: 43 years (to age 65)
Projected value: £345,800
Total deposited: £51,600 | Growth: £294,200 (85% of final value is compound growth)
Scenario 2: First-time investor (age 30)
Initial investment: £5,000 | Monthly contribution: £250 | Period: 35 years (to age 65)
Projected value: £456,400
Total deposited: £110,000 | Growth: £346,400
Scenario 3: Mid-career catch-up (age 40)
Initial investment: £20,000 | Monthly contribution: £500 | Period: 25 years (to age 65)
Projected value: £497,200
Total deposited: £170,000 | Growth: £327,200
Scenario 4: Pre-retirement boost (age 50)
Initial investment: £50,000 | Monthly contribution: £1,000 | Period: 15 years (to age 65)
Projected value: £410,600
Total deposited: £230,000 | Growth: £180,600
These scenarios demonstrate that while starting early with small amounts is ideal, it is never too late to start. Even beginning at age 50 with larger contributions can build a meaningful retirement pot.
Frequently Asked Questions
The calculator provides a projection based on a constant annual return and regular contributions. In reality, stock market returns vary significantly year to year. It should be used as a planning tool to understand the approximate power of compound growth, not as a precise prediction.
For a diversified global equity portfolio held long term, 5–7% is a reasonable estimate. If you prefer a nominal return before inflation, 7–8% is commonly used. For blended portfolios with bonds, 4–5% may be more appropriate.
Not exactly. Compound interest refers to interest earned on interest in savings accounts. For investments, compound growth includes capital gains and reinvested dividends, which together create a similar snowballing effect.
At a 7% annual return, investing £500 per month from scratch would take roughly 38 years to reach £1 million. Starting with a lump sum shortens the timeframe. Use the calculator to model your specific scenario.
Historically, investing a lump sum immediately has often outperformed drip-feeding because markets trend upwards over time. However, monthly investing reduces timing risk and is easier for most investors to maintain consistently.
The calculator does not automatically adjust for inflation. To estimate real returns, subtract an inflation assumption, typically 2–3%, from your expected return before entering the figure.
Yes. Pension contributions receive tax relief, meaning a basic-rate taxpayer contributing £200 per month is effectively investing £250 after tax relief. Adjust your contribution figure accordingly.
Low-cost equity index funds and ETFs are widely used for long-term compound growth because they provide diversification at low cost. Holding them within a Stocks and Shares ISA keeps growth free from UK capital gains and dividend tax.
Monthly compounding is standard for most investment platforms and produces slightly higher returns than annual compounding over long periods.
Market declines are a normal part of investing. Historically, markets have recovered from downturns over time. Continuing regular contributions during downturns allows you to buy investments at lower prices.
Related Reading
How to Start Investing in the UK (2026) — A complete beginner’s guide to getting started with investing
How to Invest in the S&P 500 from the UK (2026) — Step-by-step guide to buying S&P 500 ETFs from the UK
Best Stocks and Shares ISA UK (2026) — Compare the top ISA platforms for tax-free investing
Capital Gains Tax on Shares UK (2026) — Understand CGT rates, allowances, and how to minimise your tax bill
Capital at risk. The value of investments can fall as well as rise, and you may get back less than you invest. The projections shown by the investment calculator are for illustration purposes only and are not guaranteed. They do not account for inflation, platform fees, or market volatility unless manually adjusted. Past performance is not a reliable indicator of future results. Tax treatment depends on individual circumstances and may change. If you are unsure whether investing is right for you, please seek independent financial advice.